

 Customer Reviews
All good athletes or business executives will tell you that they became successful only after they focused on mastering a process. They improved their efficiency, effectiveness, and productivity at work. They obsessively studied which of their habits led to success and which did not.
However, implementing a process into a business, department, or even a team is an entirely different beast than honing your own personal idiosyncrasies and priming these up for success.
With so many moving parts, how do you track and refine each aspect of your business's process?
Data flowcharts help organizations understand, perfect, and implement new processes or systems in a simple and efficient manner. These are simple to understand and prune as well, being visual representations of your process or system.
Systems exist across multiple industries to automate manual tasks for users. To that end, any process in any system will accept data, sort it in a useful way, and then return data (in a more practical, usable form) as output. Data flow charts are ideal for depicting these scenarios because they assist viewers in visualizing and comprehending data stores, data flows, and business processes.
With SlideTeam’s Data Flow Chart PPT Templates, you can now map the data required for a process to run.
The 100% customizable nature of the templates provides you with the desired flexibility to edit your presentations. The content-ready slides give you the much-needed structure.
Get your hands on these designs, and you’ll soon be flowcharting your way to better documentation.
Template 1: SIPOC Flow Chart
SIPOC diagrams are a type of process mapping. This presentation template serves as a tool for a team to use before beginning work on a process improvement project to identify relevant elements. This design highlights the database, material inventory, and stages, such as suppliers, inputs, processes, outputs, and customers. Download this slide now and avoid any pitfalls or obstacles that stand in the way of you from delivering better results.

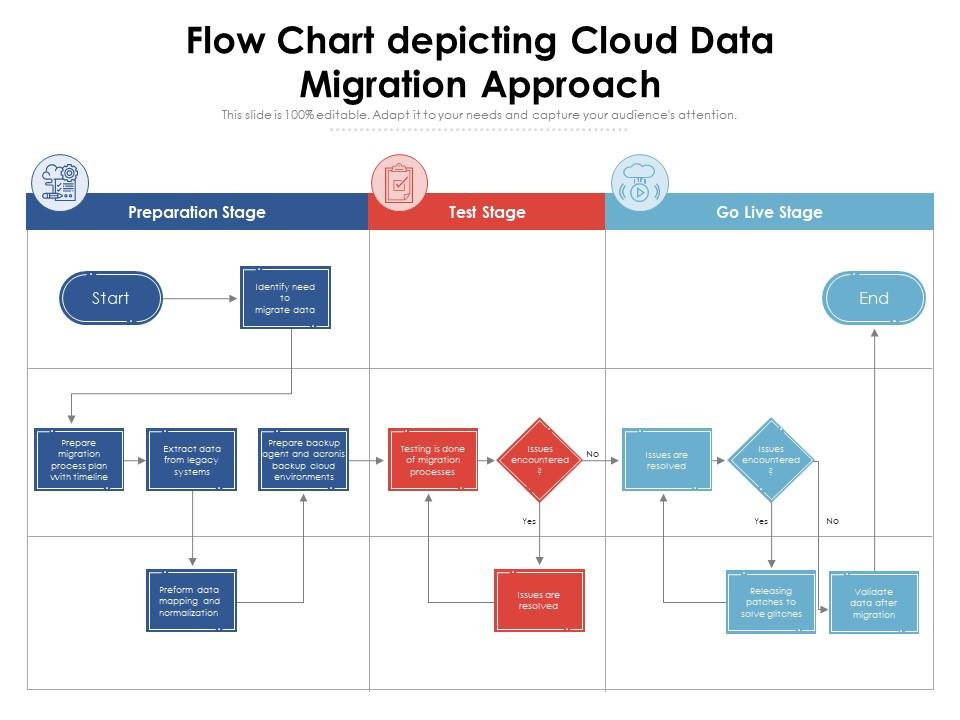
Template 2: Flow Chart Depicting Cloud Data Migration Approach
Cloud migration converts business workloads and applications into a digital process within a cloud-hosting environment. Our flow chart template that depicts a cloud data migration approach will help you move enterprise data and infrastructure from on-premise to off-premise. This process has three stages: preparation, testing, and going live. The design allows you to see and understand your data environment and interact with data to give it the meaning you like. It is a bit like harnessing the power of nature. Download it right now.
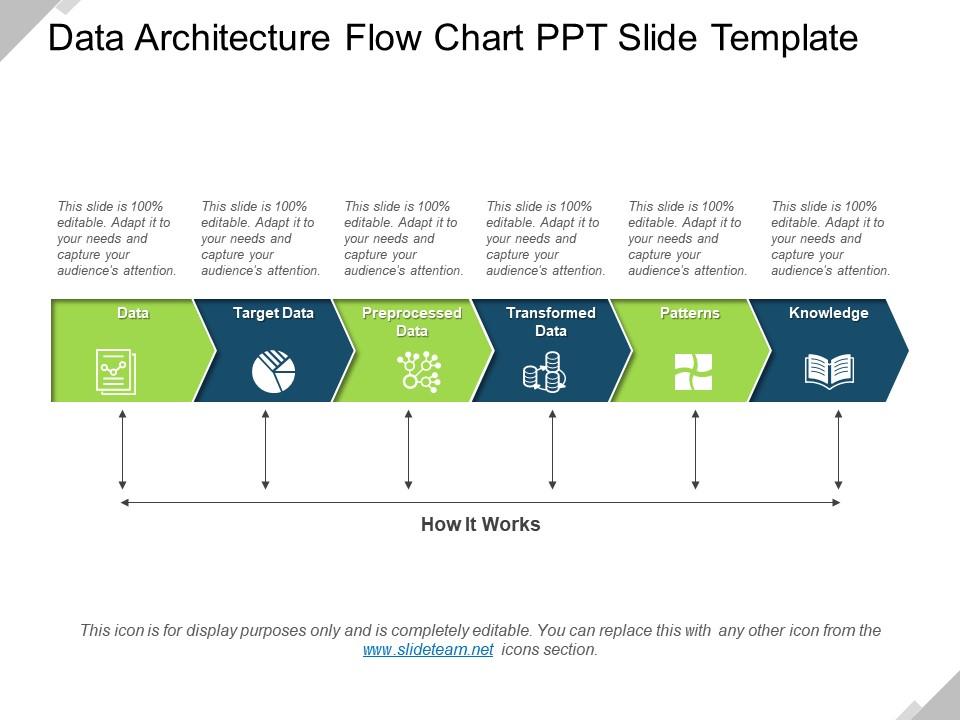
Template 3: Data Architecture Flow Chart
Our innovative PPT Template is useful for developing the architecture with subject matter experts and displaying data flow between processes across an organization. It assists you in developing an enterprise data strategy and discussing data structure strategies with team members. Download now and deal with intrusions with ease.
Template 4: Data Validation Process Flow Chart
Use our data validation process flowchart PPT Template to ensure data accuracy and quality. You do this with the incorporation of several checks into a system or report to ensure that input and stored data are logically consistent. Use this design to validate and verify all collected data before it becomes an input in decision-making. Get this design now and lay the groundwork for effective data management.
Template 5: Organizational Data Cleansing Process Flow Chart
Get our Data cleaning process flow chart template because it is one of the most important steps for your organization if you want to build a culture of quality data decision-making. This slide explains how to repair or delete incorrect, corrupted, incorrectly formatted, duplicate, or incomplete data from a dataset. Get it now, increase overall productivity, and use top-class information for your important decision-making.

GET INTO THE FLOW NOW!
Data flowcharts help people involved in the process (such as managers and engineers) understand how any system makes use of objects. It allows them to see how data moves from one object to the next, making it easier to detect errors.
Data flow charts assist managers and teams in carrying out plans and tasks competently by providing a simple yet engaging visual guide on multi-level—and otherwise complicated—methodologies.
All in all, they're pleasing to the eye!
Now is the perfect time for you to grab one of these amazingly constructed designs and push your organization toward improved productivity and wider success.
P.S.- SlideTeam brings you Must-have Marketing Process Flowchart Templates to attract and retain customers, build brand recognition, and increase sales. Check them out now!
FAQs On Data Flowcharts
What is data flow in a flowchart?
Data flowcharts are used to graphically represent the flow of data in a business information system. It describes the processes that occur in a system to transfer data from the input to file storage and to generate reports.
Data flowcharts are classified as logical or physical. A logical data flow chart depicts the flow of data through a system to perform specific business functions. The physical data flowchart depicts how the logical data flow is implemented.
What is the purpose of a Data Flowchart?
A data flow diagram (DFD) depicts the flow of information through a process or system. DFDs assist you in better understanding the operation of a process or system to identify potential problems, improve efficiencies, and develop better processes.
What are the advantages of Data Flowcharts?
1- It aids in describing a system’s boundaries.
2- It is useful for disseminating existing system knowledge to users.
3- It is a simple graphical technique that is easy to recognize.
4- DFDs can represent system components in great detail.
5- It is included in the system documentation file.


![Top 10 Customer Service Flowchart Templates To Optimize Your Support Operations [Free PDF Attached]](https://www.slideteam.net/wp/wp-content/uploads/2022/06/Top-10-Customer-Service-Flowchart-Templates-493x215.gif)